Mastering Multiplication with the Times Table Chart 0-12
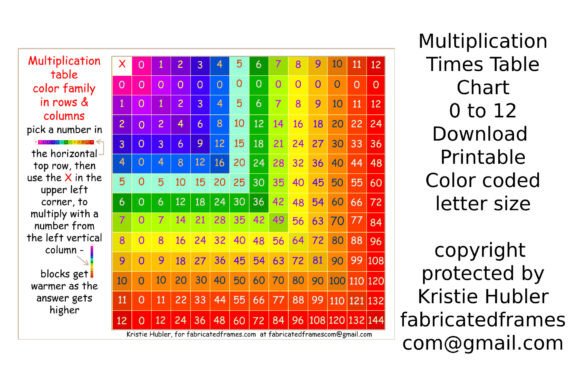
Teaching a child the multiplication facts is a foundational step in their mathematical journey, but the traditional rote memorization approach can often feel daunting and disconnected. The right visual tool, however, can transform this challenge into an engaging and intuitive process. A thoughtfully designed Multiplication Times Table Chart 0-12 does more than just list numbers; it leverages color, layout, and typography to create a learning aid that supports cognitive development and builds confidence. This particular chart stands out by using a color-coded number family system, turning abstract numbers into a visually guided experience that helps children understand the process of multiplication, not just memorize the answers.
A Visual Guide to Number Families
What makes this chart exceptionally effective is its intelligent use of color to create visual pathways. Instead of a simple grid, the sheet is organized so that each number and its corresponding answers within the times table are grouped into distinct color families. This isn't arbitrary coloring. The designer utilized the color wheel, starting with pinks and moving through cooler tones before transitioning into warmer hues. This progression subtly mirrors the increasing value of the numbers and their products, providing a subconscious visual cue for the child. A bright red "X" in the top left corner serves as a clear, friendly reminder of the operation at hand, guiding the child to find a number on the left vertical axis, meet the "X," and then locate the number on the horizontal top row to complete the equation. This color-coordinated navigation turns the chart into a map, helping young learners identify the correct row and column with greater ease and accuracy.
Beyond the Classroom: Practical Applications for Designers and Creators
While its primary purpose is educational, the design principles embedded in this Multiplication Times Table Chart hold valuable lessons for professionals in branding, marketing, and content creation. The strategic use of color coding to organize complex information is a cornerstone of effective visual communication. Consider how similar techniques can be applied:
- Infographics and Data Visualization: Use a cohesive color family to represent different data sets, making charts and graphs more readable and engaging for your audience.
- Website Navigation: Color-coding menu categories or interactive elements can guide users intuitively through a site's structure, improving user experience.
- Packaging Design: Differentiate product lines or flavors using a consistent color palette, allowing customers to quickly identify their preferred option on a crowded shelf.
- Social Media Graphics: Create a series of branded content where each theme or topic is associated with a specific color, strengthening brand recognition across posts.
- Editorial Layouts: Use color blocking and subtle hue shifts to separate sections in a magazine or report, making dense information feel more approachable and organized.
The chart’s design demonstrates that functionality and aesthetics are not mutually exclusive. It solves a specific problem—making multiplication accessible—through deliberate visual design, a principle that applies equally to creating a memorable logo, an inviting product package, or a user-friendly app interface.
The Role of Typography in Learning and Branding
A crucial, yet often overlooked, element of this educational tool is its typography. The chart intentionally uses the Comic Sans font, a choice driven by practicality rather than trend. Its rounded, irregular letterforms are widely recognized for aiding readability, particularly for children and individuals with dyslexia. This highlights a fundamental consideration in design: the primary goal of typography is to communicate a message clearly. Whether selecting a sans serif font for its clean modernity on a website, a serif font for its traditional authority in a book, or a handwritten font for a personal touch on an invitation, the choice must align with the project's functional and emotional goals.
The creator of this chart also offers versions in a custom "Fabric Font," introducing a playful, textured display font that adds a layer of visual interest. This approach is smart for both education and branding. For a child, encountering different typefaces can aid in visual discrimination. For a business, developing or utilizing a unique premium font or creative font can become a powerful component of a brand identity. A distinctive typeface used consistently across logos, marketing assets, and merchandise fosters immediate recognition and sets a brand apart. It’s not just about what the words say, but how they look and feel.
Practical Advice for Selecting and Using Fonts
Drawing inspiration from the thoughtful approach of this multiplication chart, here are some practical tips for incorporating effective typography into your own projects:
- Define the Project's Voice: Is it professional, whimsical, urgent, or elegant? Your font choice should reflect this personality. A law firm's website and a bakery's packaging require vastly different typographic treatments.
- Prioritize Readability: No matter how beautiful a font is, if your audience struggles to read it, your message fails. Always test fonts at various sizes and on different backgrounds, especially for body text on screens.
- Master Font Pairing: Combining fonts creates hierarchy and visual interest. A common strategy is to pair a serif font for headings with a sans serif font for body text, or a bold display font with a simple, neutral companion. Ensure they have complementary rhythms and contrasts.
- Understand Licensing: If you plan to use a font for commercial purposes—like on products for sale, in client work, or in monetized content—you must ensure you have the correct commercial font license. This is a critical legal and ethical step for designers, entrepreneurs, and creators.
- Build a Versatile Toolkit: Curate a small collection of fonts that serve different purposes: a reliable workhorse for long text, a striking headline font, and perhaps a specialty font for accents. This ensures visual consistency across all your brand touchpoints.
Ultimately, whether designing a learning aid for a child or a brand identity for a startup, the core principles remain the same. Understand your audience, guide them with clear visual cues, and choose every element—from color to typography—with intention. The Multiplication Times Table Chart 0-12 is a small but powerful example of how thoughtful design can make information not only accessible but genuinely helpful, a goal worth striving for in any creative or commercial endeavor.